Predictive Quality Analytics for a Leading Irish Food Manufacturer
Identifying which production attributes actually drive product quality — and building a tool to predict it.
Predictive quality analytics uses historical production data and machine learning to identify which process variables most affect finished product quality — and to predict quality outcomes before evaluation. This case study shows how it works in practice.
What This Meant for the Business
Identified which production attributes actually drive quality — out of 150+ being measured
Gave the quality team an evidence-based ranked list to act on, replacing guesswork
Delivered a working prediction tool — not a slide deck
At a Glance
| Problem | Approach | Deliverable | Next Step |
|---|---|---|---|
| 150+ attributes collected but no way to link them to quality outcomes | Statistical analysis + ML models (XGBoost, SHAP) on 350+ product records | Ranked attribute list, predictive models, working prototype tool | Phase 2 scoped for production-grade tooling |
The Challenge
A production facility within one of Europe's largest food groups, with approximately 120 people at the Connacht site, had invested significantly in collecting detailed quality control data across their production process. For every product batch, they recorded over 150 attributes — raw material specifications, processing parameters, environmental conditions, and time-temperature profiles tracked across multiple stages of production.
They also had something most manufacturers don't: formal quality assessments from trained evaluation panels, scoring finished products across multiple quality dimensions. Combined with their BRCGS-aligned HACCP process controls, Bord Bia quality standards, and raw material specifications, there was a rich dataset — but no way to connect production inputs to quality outcomes at scale.
The data sat in spreadsheets. The quality team knew their products varied, but they couldn't explain why. Some batches consistently scored well. Others underperformed. The patterns weren't visible in Excel.
The core questions were:
Do the production attributes we're measuring actually correlate with finished product quality?
Which attributes matter most? Which can we stop measuring?
Can we predict quality outcomes from production data alone — before the product reaches evaluation?
Do different product lines behave differently, or is there a universal quality driver?
This wasn't an AI-for-the-sake-of-AI project. It was a commercial question: can we use data we already collect to make better production decisions?
Our Approach
Barry Gough, our CTO, led the project with support from our specialist data science team — experienced ML engineers and applied statisticians with backgrounds in production systems and explainable AI.
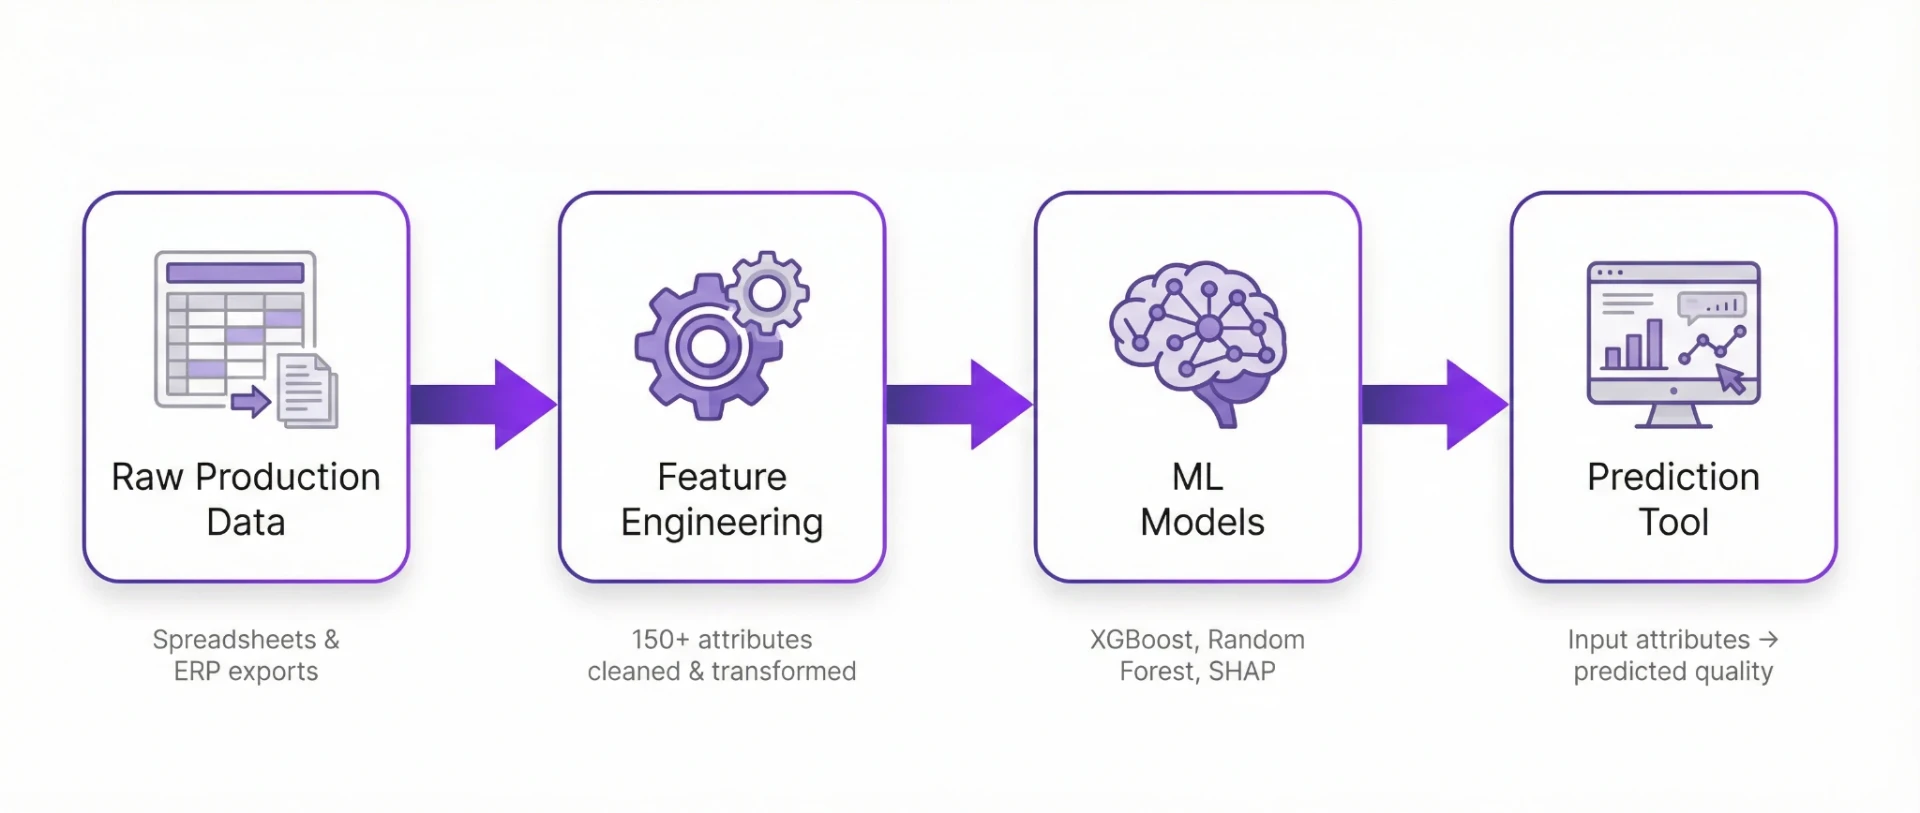
We took a systematic process analytics approach combining statistical rigour with modern machine learning:
Data Preparation and Exploration
The raw data covered 350+ product records with 150+ attributes each. Before any modelling, we spent the first week on data quality: auditing for missing values, outliers, and inconsistent coding. We restructured the data into a clean, reusable schema designed to accommodate future production runs.
A critical step was feature engineering from the time-temperature profiles. Raw sensor curves can't be fed directly into models, so we extracted meaningful features: initial values, rates of change, time to key thresholds, area under the curve, and inflection points. These engineered features captured the process dynamics that matter for quality outcomes.
Statistical Analysis
We generated comprehensive R² correlation matrices showing how each production attribute — individually and in combination — relates to each quality dimension. This highlighted which measurements actually matter and which add no predictive value.
We also ran reverse analysis: taking the top and bottom quartile products and working backwards to identify what characterises the best versus the worst performers. This often reveals patterns that forward modelling misses.
Machine Learning Models
For the AI implementation phase, we evaluated multiple approaches to find what works best for this specific data: gradient boosting (XGBoost), random forests, support vector machines, and explainable boosting machines. We tested both regression (predicting exact scores) and classification (predicting quality grades) to determine which gives the most practical results.
All validation was performed at the batch level using proper cross-validation — ensuring honest accuracy estimates that reflect real-world performance, not overfitting to the training data.
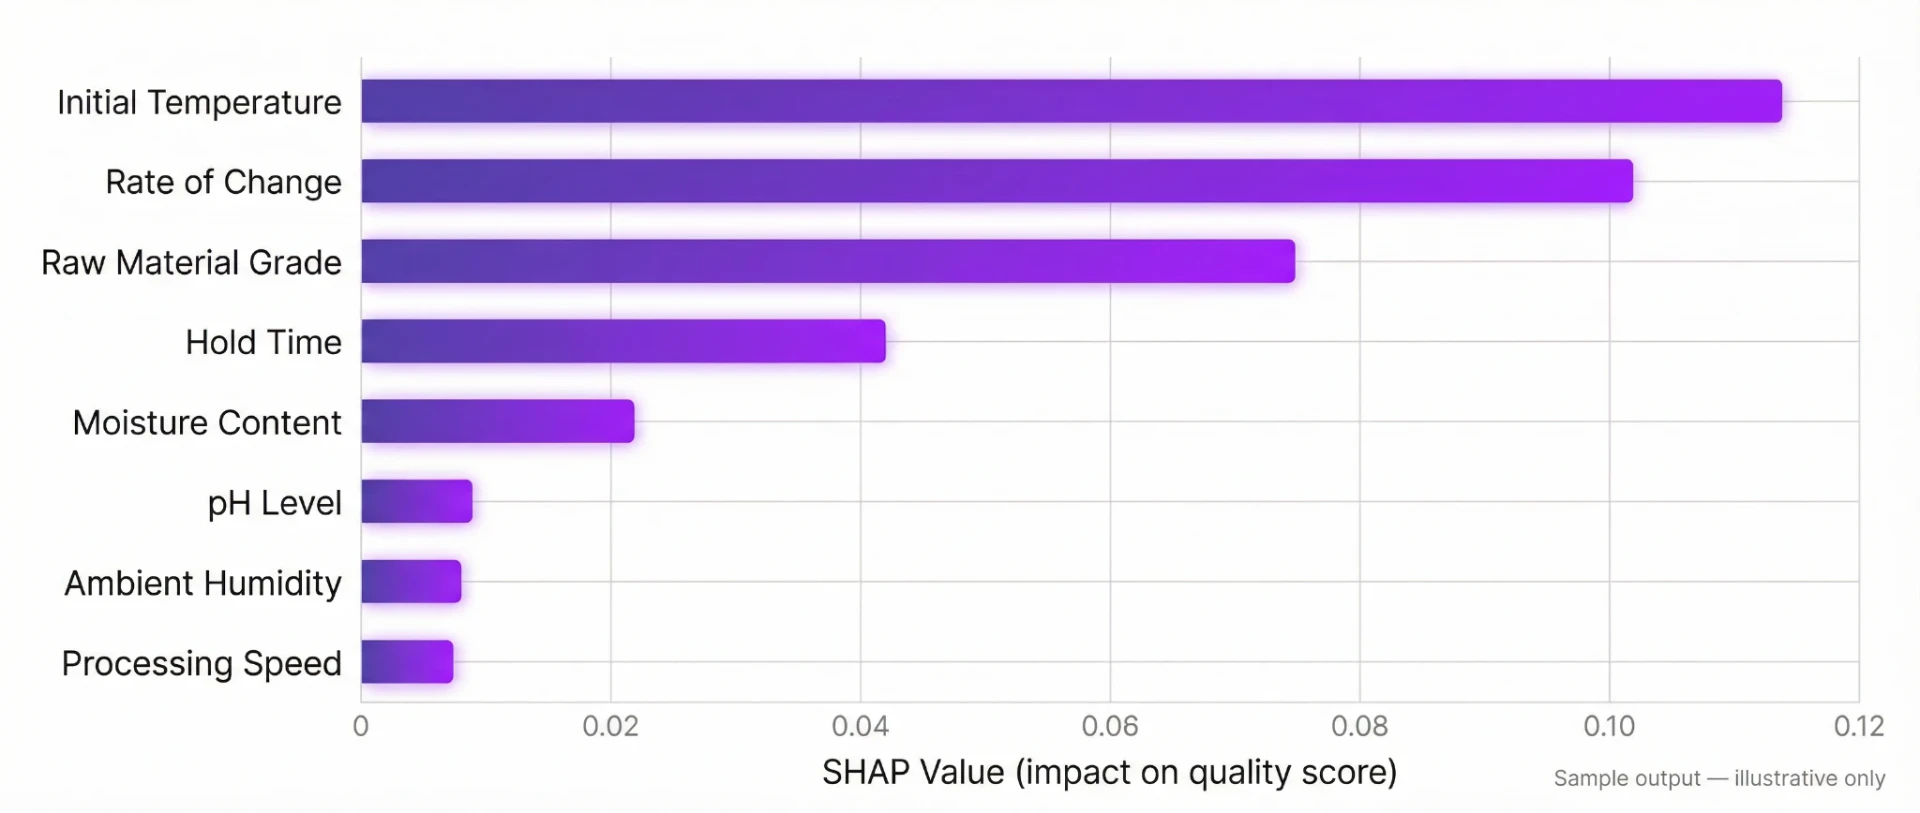
We used SHAP analysis to make every prediction explainable: not just what the model predicts, but why.
Deliverables and Prototype
We packaged everything into clear, actionable outputs: a comprehensive technical report, an executive summary for senior stakeholders, and a working prototype tool that lets the quality team input production attributes and see predicted quality scores with explanations.
What We Delivered
Clean Data Schema — The raw spreadsheet data restructured into a format designed for ongoing analysis. Built to accommodate future production data without repeating the preparation work.
R² Correlation Matrices — Comprehensive tables showing which production attributes correlate most strongly with each quality dimension. Revealed that a small subset of attributes drives the majority of quality variation.
Feature Importance Rankings — A ranked list of which attributes matter most. Identified the "golden attributes" that drive prediction and highlighted which data points add little value — potentially saving measurement effort.
Quartile Analysis — Detailed breakdown of what characterises top-performing products versus bottom-performing products. Patterns the quality team hadn't been able to see in spreadsheets.
Predictive Models — Trained machine learning models for predicting quality outcomes per product line and overall. Model artefacts and code included so the client can apply them to new production data.
Working Prototype Tool — An interactive application where the quality team can input production attributes and see predicted quality scores with explanations of which factors are driving the prediction.
Technical Report and Executive Summary — Full documentation covering data used, models developed, evaluation methodology, results, key insights, and recommendations for next steps. Written for both technical and non-technical stakeholders.
The Outcome
The analysis confirmed that a subset of production attributes — significantly fewer than the 150+ being measured — drives the majority of quality variation. The client now knows which measurements matter and which they could potentially reduce or eliminate.
"This was the first time the quality team could see — in data — what they'd always suspected about which attributes actually matter. The ranked list gave them something concrete to act on."— Paraphrased from project debrief
The predictive models achieved strong predictive accuracy for the primary quality dimensions and moderate accuracy for secondary dimensions — giving the production team a tool they can use alongside their existing processes. The best-performing models correctly distinguished top-quartile from bottom-quartile products in the majority of cross-validation runs.
The engagement was structured as a fixed-price Phase 1 project. An optional Phase 2 was scoped for production tooling and a sampling protocol — designed to be informed by Phase 1's findings about which attributes prove most predictive.
Important context
Data science projects deliver evidence, not guaranteed outcomes. If this analysis had concluded that the data doesn't support reliable quality prediction, that would still be a valuable deliverable — it saves the client from investing further in the wrong direction. We state this upfront in every data science engagement.
All client data was processed within the EU/EEA. No production data was used to train general-purpose models. All data was returned or securely deleted at project completion per our standard data handling agreement.
The client used the Phase 1 findings to inform their quality improvement programme and has scoped Phase 2 for production-grade tooling.
Results vary by business. Figures shown are measured and estimated during delivery.
Why This Worked
Senior-Led Delivery
Barry Gough managed day-to-day delivery with 20 years of enterprise technology experience. Our specialist data science team includes experienced ML engineers and applied statisticians.
Honest About Outcomes
We sell decision-grade evidence, not guaranteed predictions. We state upfront that negative findings — data that doesn't support a hypothesis — are valid deliverables. This builds trust and ensures the client gets genuine insight.
Practical, Not Academic
Every output was designed for business use: prototype tools for the quality team, executive summaries for the board, and clean data schemas for ongoing analysis. Not a research paper that sits on a shelf.
Minimal Disruption
The entire engagement required less than 8 hours of client team time across 4–6 weeks. We worked from exported data — no factory floor access needed, no system integrations, no IT overhead.
What It Cost
| Phase 1: Predictive Quality Analytics | |
| Total project value | €21,000 |
| Enterprise Ireland funding (50%) | −€10,500 |
| Client investment | €10,500 |
| Discovery engagement: from €3,000 with Enterprise Ireland funding at 80%. | |
All prices ex-VAT.
Project costs vary depending on scope, data complexity, and what grant funding is available. We scope and price every project individually during the Discovery phase, so you will know the full investment before committing to a build.
Frequently Asked Questions
Related Reading
Is This Right for Your Business?
This approach could work for you if:
- You manufacture 50+ product lines
- You collect quality, process, or ingredient data — even in spreadsheets
- You have 6+ months of historical production records
- You're spending time on quality issues you can't fully explain
- You want to move from reactive quality control to predictive
If that sounds familiar, the Discovery is the place to start.
Have Production Data You're Not Using?
A 20-minute call to understand your data and explore whether predictive analytics could help your quality, yield, or operations.
Or email us at hello@deeppurple.ai
Want to understand the process first? See how we work →
About Barry Gough
CTO, Deep Purple AI Consulting
Barry Gough is the CTO of Deep Purple AI Consulting. With an MSc in Computer Science from University College Dublin, where machine learning was a core focus of his studies, and over 20 years building production software systems, Barry brings formal ML training and deep hands-on engineering experience to every AI and data analytics engagement.
Barry completed his masters at UCD in 2011, studying ML algorithms, statistical modelling and data-driven systems just as big data techniques were maturing and deep learning was about to transform the industry. Barry joined Purpledecks in 2016 and has led the technical delivery of enterprise projects incorporating machine learning, computer vision, data classification, predictive features and recommendation engines for commercial clients across Ireland and the UK.
In 2023, Barry architected and built Reactable AI from the ground up as an internal Deep Purple product, a self-learning system that generates and optimises marketing campaigns across channels. Reactable AI was one of Ireland's earliest production deployments of autonomous AI agents, requiring him to design systems where AI made real decisions with real consequences.
At Deep Purple, Barry leads all technical delivery: AI system architecture, machine learning model development, data pipeline engineering, and manages a team of experienced ML engineers and applied statisticians. His combination of formal ML education, years of incorporating AI into commercial projects and hands-on experience architecting autonomous AI systems means clients work with a technical lead who can make genuine engineering decisions about AI.
Deep Purple AI Consulting (deeppurple.ai) is an AI consultancy and custom software development company based in Longford, Ireland, serving clients across Ireland, the UK, the EU, and the US. We help established businesses identify where AI can make a real difference, then build the systems to make it happen.
We use cookies to ensure our website works properly and to help us improve it. You can accept all cookies or customise your preferences. See our Cookie Policy for details.