How a 2-Minute Photo Submission Replaced a Week of Paper Dockets
Paper dockets and days of reconciliation eliminated
Down from 15-20% with tape measures
Real-time progress, billing, and quality across all sites
Enterprise Ireland supported
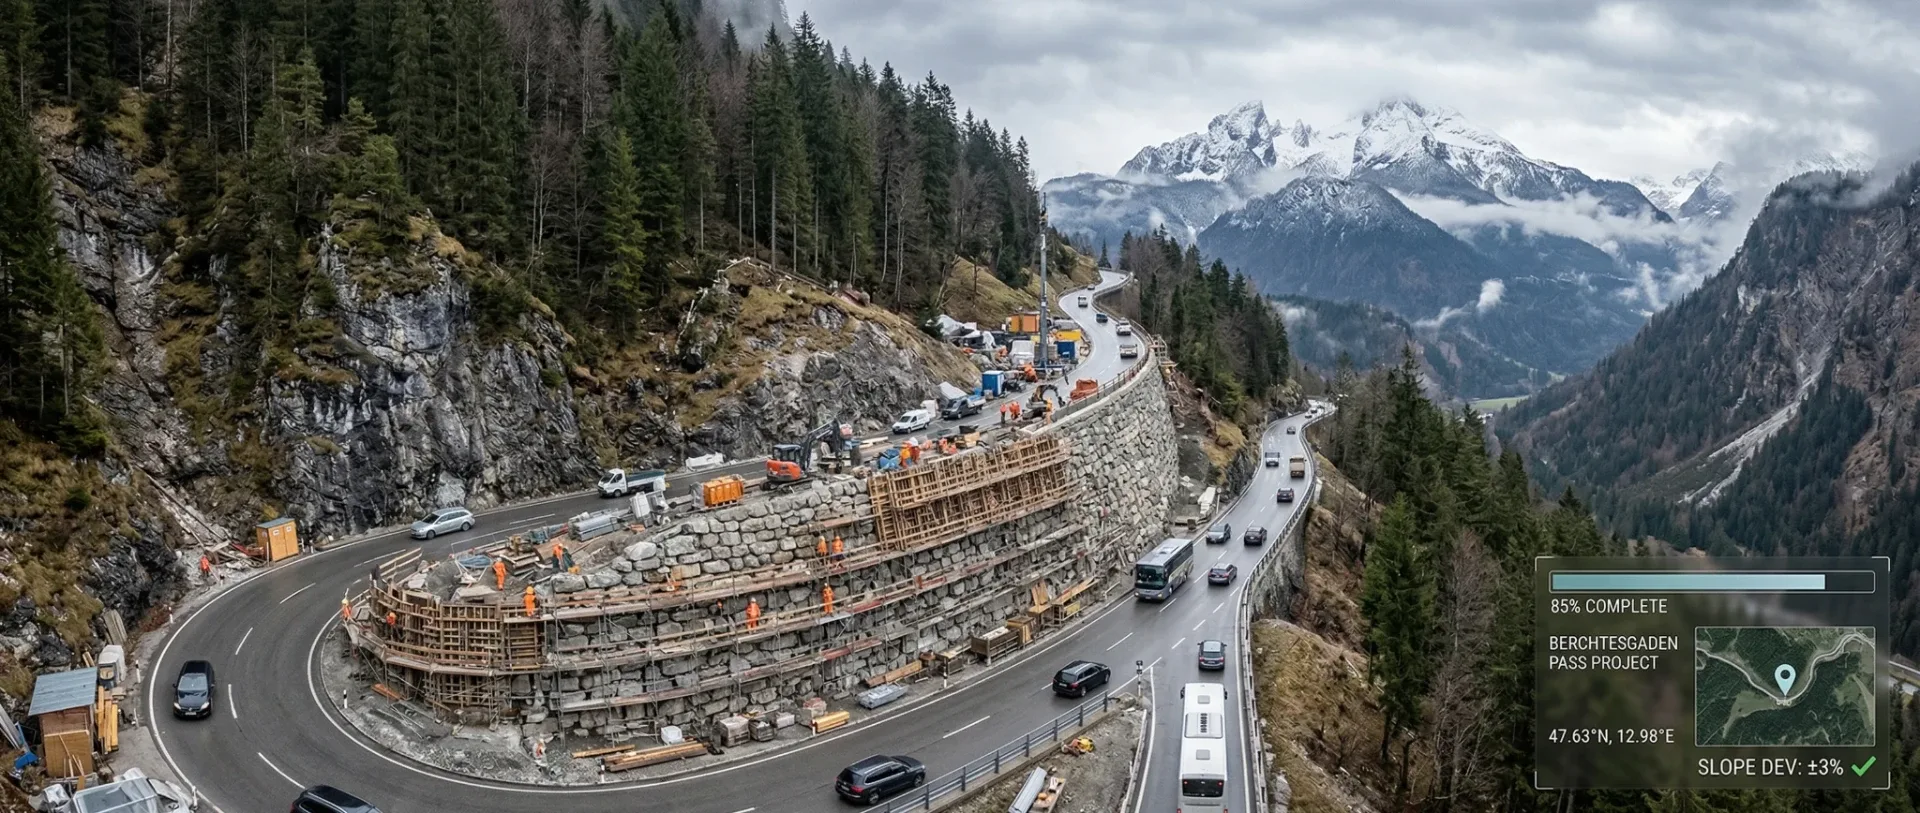
Deep Purple built a mobile app that turns a photograph of completed construction work into a verified, GPS-stamped measurement with ±3% accuracy. The operative takes a photo, draws an outline, and submits. Two minutes. The data is in the system immediately. Progress reports, billing, quality review, and productivity tracking update automatically. No paper dockets. No back-office reconciliation. No week-long delay.
At a Glance
Deep Purple developed a custom React Native mobile app using OpenCV and ArUco marker calibration for an Irish construction company to automate field measurement, progress reporting, and quality oversight across multiple sites.
The Challenge
Picture this. It is Tuesday morning. You manage a specialist construction company. You have 30-plus operatives spread across six or seven active sites in three countries. They are doing heritage and infrastructure work using traditional construction methods. Specialist materials. Skilled tradespeople. Competitive tenders on measured works contracts with tight margins.
Every operative records their daily output on paper. Triplicate docket books. They measure what they built with a tape measure, write it down, and submit it to the office. Back office staff reconcile these dockets, usually days later. Sometimes a week.
The measurement itself is quick. The problems are everything that happens after it.
Tape measure readings on irregular surfaces carry significant error. When the company compared docket totals against verified remeasurements on completed sections, the variance was consistently 15-20%. On a measured term contract where payment is tied directly to meterage, that kind of error means money left on the table or disputes with the client's quantity surveyor.
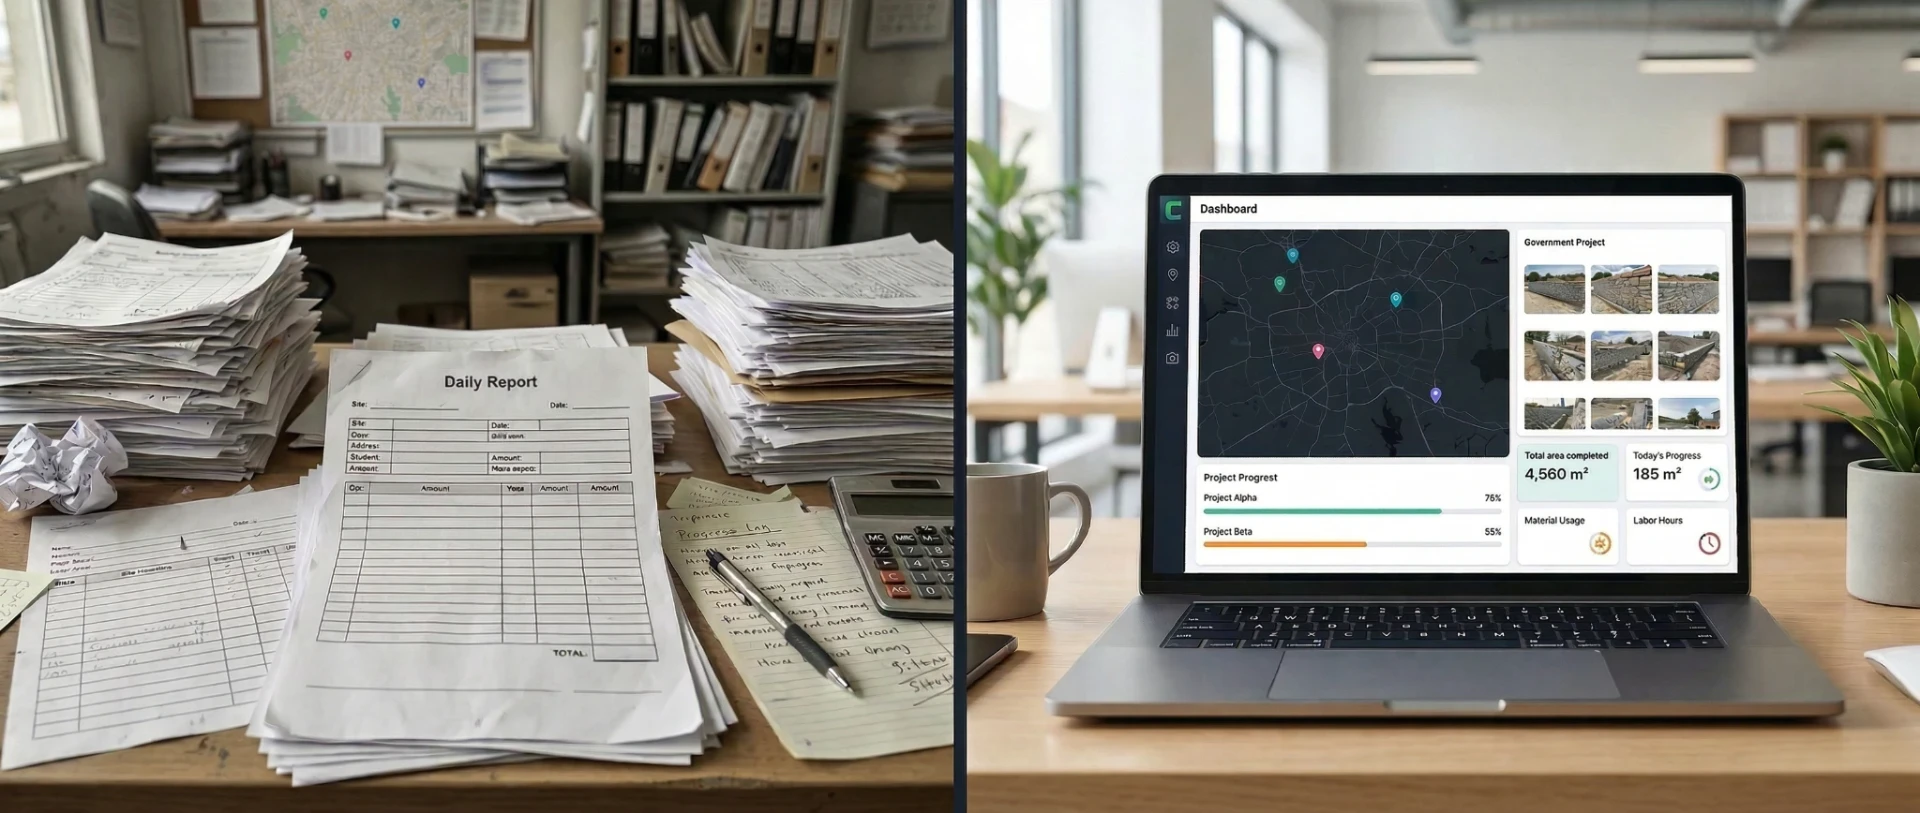
But accuracy is only half the problem. The real pain is the delay. Dockets sit in pockets, in vans, in site offices. They arrive at head office in batches. Someone has to enter them, cross-check them, chase the missing ones, resolve discrepancies. By the time the data is usable, the working week it describes is already over. Problems that could have been addressed on Tuesday are only visible on Friday.
Project managers have no way to know which sites are on track without driving out to check. Client progress reports are compiled manually from reconciled dockets, not from live data. Billing is based on reconstructed figures, not verified evidence. Quoting for new work is based on spreadsheets and experience, not verified historical data.
Weather is not background context in this industry. It is an operational variable that affects every day's output. Mortar cannot be applied below 4°C. Wind forces site closures. Rain changes everything. None of this was being tracked or correlated with productivity. When weather stops work, there is no evidence to back up a lost-day claim.
Operatives are paid based on area completed, so inaccurate measurement means unfair pay.
The business was flying without instruments. The managing director knew the data existed inside the business. Every day, every operative, every site was generating information about productivity, materials, weather impact, and quality. None of it was being captured in a way that could be used.
For more on how Deep Purple approaches computer vision for construction and field operations, see our service page.
The first thing we did was spend time understanding the business properly. Not the software problem. The actual work. How do operatives spend their day? What does fair compensation mean to a worker who has built 14 square metres and wants to know they will be paid for exactly that? What does a project manager actually need to know by 9am on Monday morning?
That understanding shaped every decision we made. We also recognised early that the right approach was phased. The client needed to see the core concept proven before committing to a full build. We proposed a Proof of Concept followed by a full platform, with a clear decision point between the two.
Why Off-the-Shelf Tools Failed
We looked at what was available. Nothing fit.
Most construction software is designed for main contractors managing subcontractors on large sites. This company is the specialist subcontractor. Their needs are different. They need to measure output in the field, across multiple remote sites, often with poor or no mobile connectivity.
Generic measurement apps assume controlled conditions. A construction site in February, on an exposed stretch of motorway or a heritage building in a rural area, is not a controlled condition.
The workforce is multi-lingual. Many operatives do not have English as a first language. Any system that relies on typing, reading instructions, or navigating complex menus will fail in the field. It has to be simple. Big buttons. Minimal text. Take a photo. Draw an outline. Submit.
No off-the-shelf tool could do what the client needed: let an operative outline an area on a photograph and get an accurate measurement from it. That sounds simple. It is not. To calculate area from a photograph, you need a reference object of known size in the image. Even with a reference object, accuracy depends on lighting conditions, the angle the photo was taken from, surface irregularity, and whether the camera can detect the reference reliably. This is a genuine engineering problem, not a feature gap in existing software. On top of that, any solution had to work offline, because these operatives work in places where a phone signal is a luxury.
And measurement was only part of the problem. There was no system available that could take field submissions and turn them into verified progress reports, quality oversight, and billing data automatically. The tools that exist handle one piece. None of them connected measurement to reporting to quality to payment in a single workflow.
There was also nothing that gave operatives visibility of their own earnings. These are people paid per square metre. They want to know where they stand: how much they have completed this week, what that means for their pay, and whether they are ahead or behind their own pace. No off-the-shelf construction tool provides that. The system we built does.
The Technical Approach
How does computer vision measure area from a photograph? The operative places a calibration marker of known size, an ArUco marker, flat against the surface and photographs it. OpenCV detects the marker automatically and calculates the exact pixel-to-millimetre ratio for that image. The operative draws an outline around the completed area on the phone screen. The system computes the area within that outline using the calibrated scale. Target accuracy: ±3%, consistently achieved.
The core idea is simple. An operative photographs the area they completed that day. They place a small calibration marker flat against the surface. They draw an outline around the area with their finger on the phone screen. The system calculates the area from the photograph using the marker as a known reference for scale. Two minutes. The data is in the system.
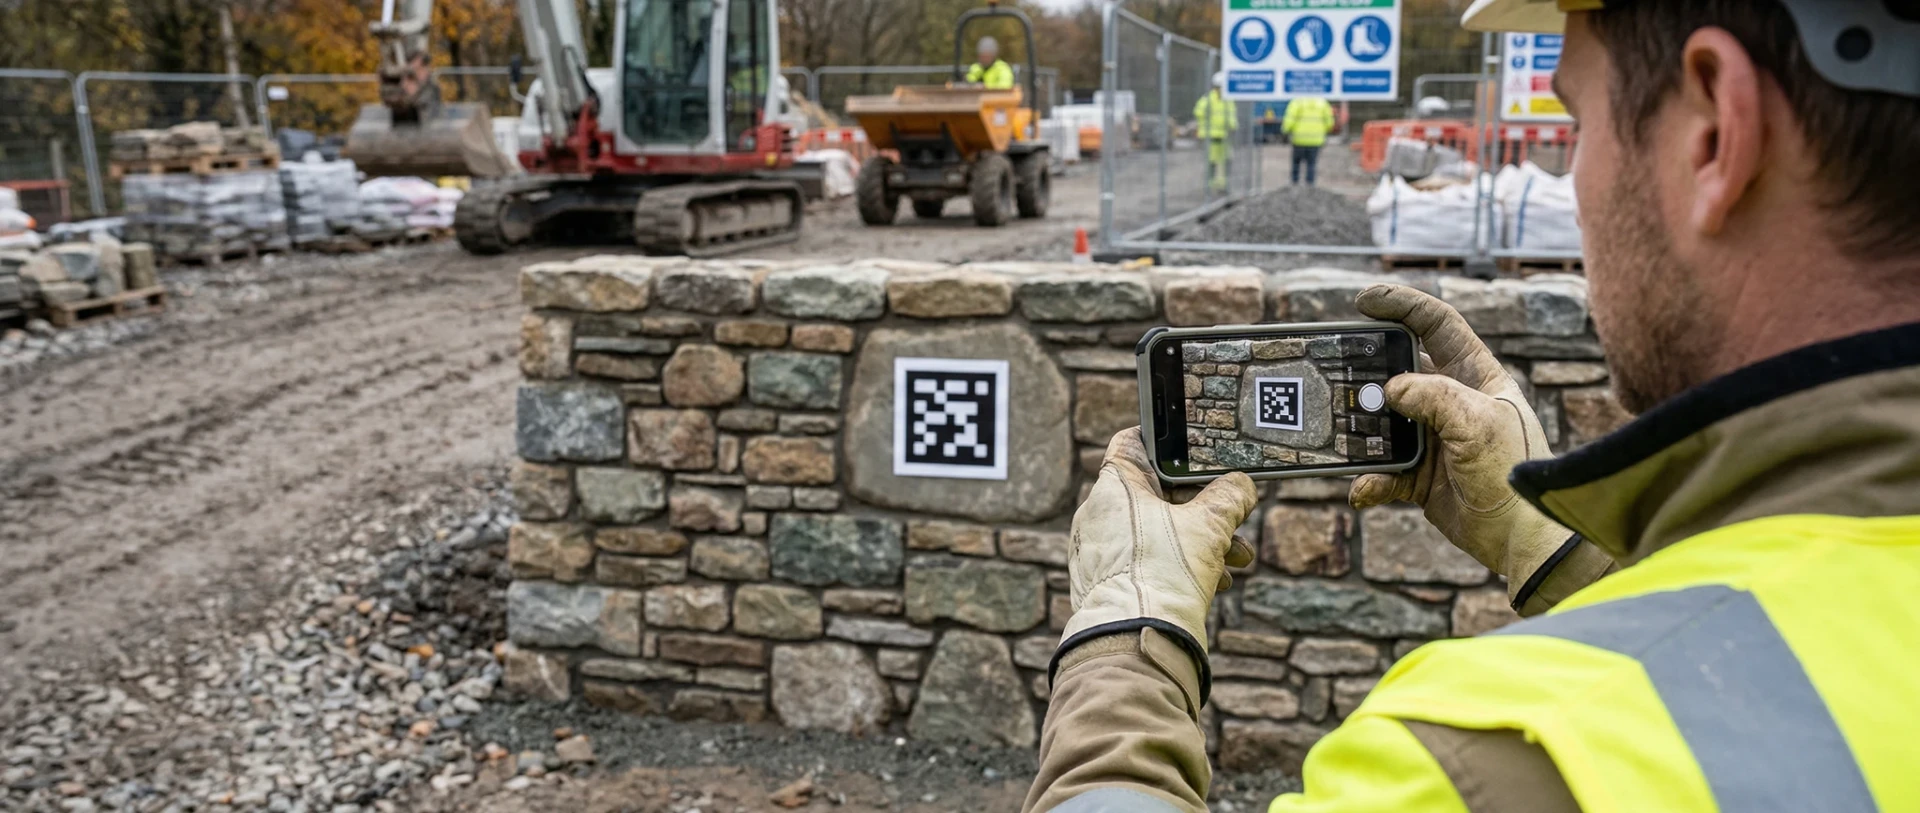
The calibration marker is an ArUco marker. A 200mm square printed pattern that OpenCV can detect automatically. Because we know the marker is exactly 200mm, the system calculates how many pixels equal one millimetre. From there, it computes the area inside the drawn outline.
This approach was chosen deliberately over more complex alternatives. The operative's workflow does not depend on connectivity. They can capture, annotate, and queue submissions offline. The area calculation itself runs on a lightweight Python microservice when the submission syncs to the backend. No heavy ML inference. No GPU infrastructure. No dependency on real-time cloud processing at the point of capture. And the calculation is deterministic. The same photograph always produces the same result. For a system that determines payment, that matters.
The operative opens the app, takes a photograph, places the marker, draws the outline, selects the site from a dropdown, and submits. GPS coordinates and a timestamp are captured automatically. The submission syncs to a Node.js backend. The Python microservice detects the ArUco marker, calculates the scale, and computes the area. Processing happens in the background. The operative gets an immediate confirmation and moves on to the next section.
Here is what changes for the business. Every submission updates the project dashboard instantly. At the end of every working day, the company knows exactly how much was done, on which site, by which operative. Progress reports are not compiled from paper at the end of the week. They are live. Client billing data is based on verified, photo-evidenced measurements, not reconstructed docket totals. Someone in the back office can review the quality of work from submitted photographs the same day it was completed, without visiting the site. And the app includes a feedback function, so operatives can flag issues (materials, conditions, access problems) that go straight to the office in real time.
Reviewers see every submission on a web dashboard with the calculated area, the photograph, the GPS location, and the timestamp.
What We Rejected and Why
ML depth estimation (PyTorch)
We investigated using machine learning models to estimate depth and surface area from photographs. Too heavy. These models need significant processing power and, in most practical deployments, cloud connectivity. An operative standing on a scaffold in a field with no phone signal cannot wait for a cloud API to respond. ArUco markers with OpenCV achieve the accuracy we needed without any of that overhead.
Large vision models (Depth Anything, DiffusionEdge, PiDiNet)
We prototyped with several large vision models during early development. We found no meaningful improvement over the marker-based approach for our constraints, and the computational requirements were prohibitive for mobile deployment. We removed them.
External AI APIs (Replicate and similar)
We rejected any dependency on external services for core measurement functionality. The system must work without internet. Full stop. No external API calls for anything critical.
In-app messaging
We considered building a chat system into the app. We rejected it. If an operative needs to talk to their project manager, they make a phone call. Building a messaging system adds complexity, development time, and maintenance overhead to solve a problem that a phone call already solves. Simpler is better.
The Build
The system was delivered in three phases.
Phase 1: Proof of Concept
The mobile app, the CV measurement engine, the backend, and the reviewer dashboard. This is what the hard metrics below are based on. The POC proved the technology works in real field conditions and established the accuracy baseline.
Phase 2: Full Platform
Real-time dashboards showing progress across every active project. Role-based access for management tiers.
The mobile app detects device language settings and renders in the operative's language automatically. Three languages are supported. Operatives have a personal productivity dashboard showing their daily, weekly, and monthly output and what it means for their earnings. They can see their own trends and track their pace. When a project manager adjusts a submitted measurement, the operative sees the change and the reason for it. This is not a black box. It is a transparent system that both sides can trust.
Per-operative productivity tracking. Weather integration that automatically pulls conditions for each site and correlates them with output. Anomaly detection flags unusual submissions in both directions, not just implausibly high output but implausibly low output too. Both matter. If two operatives submit photos of the same area, the system detects the overlap using GPS proximity and flags it for review. Earnings tracking linked to confirmed meterage. Phase 2 also builds the scaffolding for Phase 3: back office staff grade every submitted photograph for work quality. Good, bad, and why. This builds a labelled dataset that grows with every submission.
The reporting layer includes a natural language query interface. Instead of requesting a custom report and waiting, a senior manager types a question: "Which sites underperformed against target last month and what were the weather conditions?" or "What is our average daily output per operative on limestone projects compared to sandstone?" The system returns a data-backed answer with supporting charts. No technical skill required. The people who most need strategic insight are rarely the people who want to write database queries.
Phase 3: ML Quality Detection and Client Reporting
A machine learning model trained on the graded dataset from Phase 2. It flags quality issues automatically as new photographs come in. A human reviews every flag. The system learns from every correction. Phase 3 also delivers structured client-facing reports. A contractor who can show a government body or main contractor "here is our quality control system, here is the photographic evidence, here are the measurements and conditions for every day of the project" has a serious advantage in competitive tenders.
The Technology Stack
| Component | Technology |
|---|---|
| Mobile App | React Native (Android and iOS) |
| Backend | Node.js |
| CV Microservice | Python, OpenCV |
| Calibration | ArUco markers (200mm, binary fiducial) |
| Database | PostgreSQL |
| Cloud Hosting | Google Cloud Platform (EU, GDPR compliant) |
| Web Dashboard | React.js |
| LLM Interface | Natural language queries to operational data (Phase 2) |
| ML Quality | Trained on labelled quality grading dataset (Phase 3) |
All data is stored in EU-region Google Cloud infrastructure. The system handles GPS-tagged photographs of identifiable workers and is designed to comply with GDPR from the ground up.
Where the AI Struggled and How We Fixed It
Anyone can describe how a system is supposed to work. This is how it actually went.
Lighting
Construction sites do not have controlled lighting. We dealt with direct sunlight causing glare on surfaces. Low winter light. Shadows from scaffolding and structures. Rain on surfaces changing how the camera reads texture and colour. The CV system had to handle all of these. We tuned the ArUco detection parameters extensively across different lighting conditions until we had reliable detection in the range of conditions the operatives actually encounter.
Sourcing the markers
This sounds trivial. It was not. A standard printed ArUco marker does not survive a construction site. It gets wet, dirty, torn, and trampled. We had to find markers that were durable enough for daily outdoor use in construction conditions, the right size for the working distances involved, and reliably detectable by the camera. We tested multiple marker sizes to find the best balance between detection reliability at different distances and practical usability for the operatives.
Device variation
The operatives use different phones. Different manufacturers, different camera specifications, different Android versions. The same photograph taken on two different devices can produce different results. We tested across a range of devices and had to set a minimum hardware specification to guarantee consistent accuracy.
Photo angle
Not every surface can be photographed face-on. Tight spaces, awkward access points, scaffolding in the way. The system had to handle photographs taken at angles that were less than ideal. We worked on calibration logic that accounts for perspective distortion when the photo cannot be taken perpendicular to the surface.
The drawing interface
Getting operatives to draw an accurate outline on a phone screen sounds easy. In practice, it took several iterations. The interface had to work with cold hands, gloves, wet screens, and users who are not comfortable with technology. We tested different approaches to the red outline drawing tool until we found one that was intuitive enough for every operative to use reliably, every day, without training.
Edge detection
Defining where one completed area ends and another begins. On irregular surfaces using traditional construction materials, the boundary is not always obvious. This was one of the harder problems. We refined the system to handle the edge cases that real-world conditions throw at you.
Results
These are measured results from Phase 1. The POC. Real submissions from real operatives on real construction sites. Accuracy was validated by comparing CV-calculated areas against physical spot-check remeasurements on completed sections.
| Metric | Before | After |
|---|---|---|
| Data from site to office | Days (paper dockets, manual reconciliation) | Instant (photo submission, automatic processing) |
| Measurement accuracy | 15-20% error (tape on irregular surfaces) | ±3% target accuracy, consistently achieved |
| Progress visibility | Lagging by days, compiled manually | Real-time dashboard, updated with every submission |
| Evidence of work completed | None | GPS-stamped photograph with calculated area |
| Quality review | Required physical site visit | Same-day photo review from the office |
| Operative feedback to office | Delayed (paper, phone calls) | Instant (in-app feedback to back office) |
| Client progress reporting | Manually compiled from reconciled dockets | Based on live, verified data |
| Measurement queries | Manual, time-consuming | Photo evidence with calculated area |
Every submission is automatically tagged with GPS coordinates, a timestamp, the operative's identity, the site, and a full-resolution photograph. This is an auditable record. It can be used for payment verification, measurement queries, progress reporting, client billing, and quality evidence.
"The measuring was never the hard part. The hard part was getting the numbers back to the office and trusting them when they got there. Now the lads submit a photo, the system calculates the area, and I can see it on the dashboard before they have packed up for the day. The back office is not chasing dockets any more. The progress reports build themselves. And when a client asks where we are on a project, I can tell them exactly, with photos to back it up."
Spending days reconciling paper dockets?
Let's look at your process on a 20-minute call.
What It Cost and How It Was Funded
The Phase 1 POC was a €45,000 project. Enterprise Ireland covered 50% through their grant programmes. The client's investment was €22,500.
| Phase 1: Proof of Concept | |
| Project value | €45,000 |
| Enterprise Ireland grant (50%) | €22,500 |
| Client investment | €22,500 |
All prices ex-VAT.
Time to ROI. The system eliminates days of back-office reconciliation every week. It removes the cost of measurement uncertainty, reduces wasted PM travel to sites for progress checks, and gives the company verified data for client billing instead of reconstructed figures. The €22,500 client investment pays for itself within weeks, not months.
Enterprise Ireland offers two programmes that fit projects like this. The Exploring Innovation grant supports proof of concepts and prototype development. The Digital Process Innovation grant supports companies implementing new digital processes. Both offer 50% funding.
For a detailed guide to Enterprise Ireland grant programmes, see our complete guide to AI grants in Ireland.
What the Client Does Differently Now
Operational Efficiencies
Paper dockets are gone. An operative submits a photo, the system calculates the area, and the data is in the dashboard before the operative has moved to the next section. No triplicate books. No chasing missing dockets. No reconciliation.
The company knows where it stands at the end of every day
Not at the end of the week after someone has spent two days entering dockets. Every submission updates the project dashboard. Progress reports build themselves. If a site is falling behind schedule, the PM knows today, not Friday.
Client billing is based on verified evidence
Every measurement has a photograph, a calculated area, a GPS location, and a timestamp. When the company sends a progress report to a client or a main contractor, the numbers are backed by evidence. That changes the conversation.
Payment is fair and transparent
Operatives are paid per square metre on measured works contracts. The system removes uncertainty about quantities. Every measurement has a photograph and a calculated area. Both sides can see the same number. This is not surveillance. It is fairness.
Quality is visible from the office
Someone in the back office can look at submitted photographs and assess the standard of work the same day it was completed. No site visit required. Problems are caught early.
Operative feedback flows instantly
If a mason flags an issue with materials, access, or site conditions, the feedback goes straight to the office through the app. No waiting for a phone call or a note on a docket.
What This Means for the Bottom Line
The operational efficiencies are real, but the commercial impact is what justifies the investment.
Back-office labour recovered
The hours previously spent reconciling paper dockets, chasing missing submissions, and manually compiling progress reports are gone. That is staff time returned to work that actually moves the business forward.
PM time recovered
A project manager who had to drive between sites to check progress can now see every site from the dashboard in five minutes. The time and cost of site visits for progress checks alone is significant across a multi-site operation.
Revenue leakage reduced
On measured works contracts, 15–20% measurement variance means the company was either leaving money on the table or overpaying operatives, or both. At ±3% accuracy, the company captures what it is owed and pays what it should. On any meaningful annual volume of measured works, the financial difference is substantial.
Quoting margin improvement
This is the compounding advantage. The system captures verified output data: area completed, operative, materials, method, weather conditions, and time. Over months and years, the company builds a dataset that says: "On a project like this, with these materials and this method, in these conditions, our average output is X square metres per day per operative." That transforms quoting from experience and spreadsheets to evidence-based pricing. More accurate quotes mean winning more work at the right margin instead of guessing and hoping.
This dataset is a compounding asset. After twelve months of operation, the company has something genuinely rare: a verified record of productivity rates by operative, by material type, by method, by weather condition, by season. Their competitors are still quoting from spreadsheets and experience. The company is quoting from evidence. That gap widens with every month the system runs.
Weather claims backed by evidence
When weather stops work, the system has the data. Automatic weather pulls for every site. Correlated with productivity. A lost-day claim backed by verified weather data is harder to dispute. Every recovered weather day that would previously have been written off has a direct value.
Client confidence and competitive positioning
Once the planned Phase 3 ML quality system is live, the company can provide clients with structured evidence of quality control on every section of work. For government contracts and large infrastructure projects, "we have a system that measures, tracks, and evidences our quality" is a powerful line in a tender. That is not an efficiency. That is a competitive advantage that wins work.
Late completion risk reduced
On measured works contracts, late completion penalties are a real financial risk. The system gives project managers early visibility of whether a site is on track or falling behind. Problems that would previously have been invisible until the end of the week are visible the same day. That early warning is the difference between correcting course and incurring penalties.
Stronger position in competitive tenders
When two contractors tender for the same work, the one who can price from verified historical data and demonstrate a live quality control system has a material advantage. The data the system captures does not just improve internal operations. It strengthens every future bid the company submits.
The data grows more valuable every month. Every submission adds to the dataset. More data means better predictions, better quotes, better evidence, and better decisions. This is the flywheel. It compounds.
Frequently Asked Questions
Is This Relevant to Your Business?
This system was built for a specialist construction contractor. But the core technology applies to any business where field teams need to measure, document, and report.
- Quarry operators measuring stockpile volumes
- Infrastructure contractors documenting pole condition across thousands of assets
- Drone companies processing aerial survey and inspection imagery
- Facilities management teams tracking maintenance work
- Any field operation that currently relies on tape measures, paper dockets, and manual reporting
We were brought in to solve a measurement problem. What we delivered was a business intelligence platform, a quality assurance system, and a data asset that grows more valuable with every day the business uses it.
That gap, between the problem as initially described and the solution that actually serves the business, exists in almost every project we work on. Closing it requires spending time with the business first, understanding how the work actually happens, and being willing to question the first framing of a problem before committing to a solution. The detail in this case study exists because our client gave us that time. The solution is better for it.
This project aligns with the objectives of Build Digital, Ireland's programme for digital adoption in construction. The shift from paper-based site reporting to verified, real-time digital records is exactly the kind of change that programme was designed to encourage.
For MDs and Business Owners
What would change if you had an accurate, real-time picture of productivity across all your sites? What would you bid differently with two years of verified data on your own operations?
For Operations and Project Managers
What takes the most time to reconcile at the end of the week, and how often do measurement discrepancies slow you down?
For Technical Buyers
You probably have questions about the architecture. We are happy to go into depth on how the CV pipeline works, how the ML quality model is trained, and how the system integrates with your existing tools.
Deep Purple builds custom computer vision systems and AI for construction, across Ireland, the UK, the EU, and the US. We consult on whether AI is the right fit, we build the system if it is, and we help you access government funding to reduce the cost.
Deep Purple built and deployed a production computer vision system for an Irish construction company that replaced paper dockets with instant, photo-evidenced, GPS-stamped submissions. Measurement accuracy improved from 15-20% error to ±3%. Progress reports, billing, and quality review now update automatically with every submission.
Start with a 20-Minute Conversation
No pitch, no pressure. Just an honest look at whether computer vision could help your field operations.
Or start with a €1,000 AI Assessment →Related Reading
Not sure if computer vision is right for your business? Take our free 3-minute assessment.

About Barry Gough
CTO, Deep Purple AI Consulting
Barry Gough is the CTO of Deep Purple AI Consulting. With an MSc in Computer Science from University College Dublin, where machine learning was a core focus of his studies, and over 20 years building production software systems, Barry brings formal ML training and deep hands-on engineering experience to every AI and data analytics engagement.
Barry completed his masters at UCD in 2011, studying ML algorithms, statistical modelling and data-driven systems just as big data techniques were maturing and deep learning was about to transform the industry. Barry joined Purpledecks in 2016 and has led the technical delivery of enterprise projects incorporating machine learning, computer vision, data classification, predictive features and recommendation engines for commercial clients across Ireland and the UK.
In 2023, Barry architected and built Reactable AI from the ground up as an internal Deep Purple product, a self-learning system that generates and optimises marketing campaigns across channels. Reactable AI was one of Ireland's earliest production deployments of autonomous AI agents, requiring him to design systems where AI made real decisions with real consequences.
At Deep Purple, Barry leads all technical delivery: AI system architecture, machine learning model development, data pipeline engineering, and manages a team of experienced ML engineers and applied statisticians. His combination of formal ML education, years of incorporating AI into commercial projects and hands-on experience architecting autonomous AI systems means clients work with a technical lead who can make genuine engineering decisions about AI.
Deep Purple AI Consulting (deeppurple.ai) is an AI consultancy and custom software development company based in Longford, Ireland, serving clients across Ireland, the UK, the EU, and the US. We help established businesses identify where AI can make a real difference, then build the systems to make it happen.
We use cookies to ensure our website works properly and to help us improve it. You can accept all cookies or customise your preferences. See our Cookie Policy for details.